NCERT Solutions Exercise 2
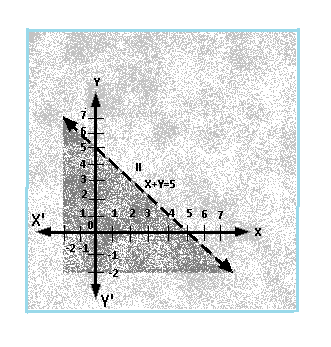
Question 1: Solve the given inequality graphically in two-dimensional plane: x + y < 5
Answer 1: The graphical representation of x + y = 5 is given as dotted line in the figure below. This line divides the xy-plane in two half planes, I and II.
Select a point (not on the line), which lies in one of the half planes, to determine whether the point satisfies the given inequality or not. We select the point as (0, 0).
It is observed that,
0 + 0 < 5 or, 0 < 5, which is true
Therefore, half plane II is not the solution region of the given inequality. Also, it is evident that any point on the line does not satisfy the given strict inequality.
Thus, the solution region of the given inequality is the shaded half plane I excluding the points on the line.
This can be represented as follows.
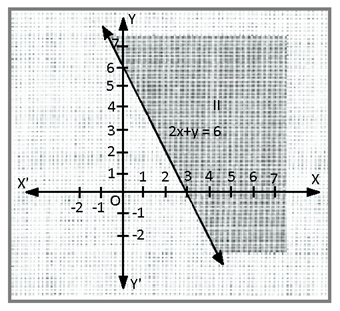
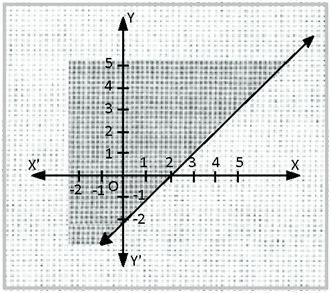
Question 2: Solve the given inequality graphically in two-dimensional plane: 2x + y ≥ 6
Answer 2: The graphical representation of 2x + y = 6 is given in the figure below.
This line divides the xy-plane in two half planes, I and II.
Select a point (not on the line), which lies in one of the half planes, to determine whether the point satisfies the given inequality or not. We select the point as (0, 0).
It is observed that,
2(0) + 0 ≥ 6 or 0 ≥ 6, which is false
Therefore, half plane I is not the solution region of the given inequality. Also, it is evident that any point on the line satisfies the given inequality.
Thus, the solution region of the given inequality is the shaded half plane II including the points on the line.
This can be represented as follows.
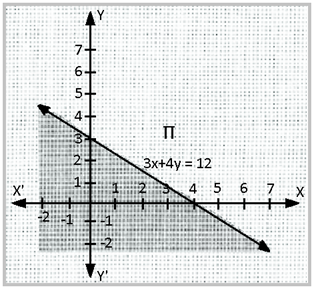
Question 3: Solve the given inequality graphically in two-dimensional plane: 3x + 4y ≤ 12
Answer 3: 3x + 4y ≤ 12
The graphical representation of 3x + 4y = 12 is given in the figure below.
This line divides the xy-plane in two half planes, I and II.
Select a point (not on the line), which lies in one of the half planes, to determine whether the point satisfies the given inequality or not. We select the point as (0, 0).
It is observed that,
3(0) + 4(0) ≤ 12 or 0 ≤ 12, which is true
Therefore, half plane II is not the solution region of the given inequality. Also, it is
evident that any point on the line satisfies the given inequality.
Thus, the solution region of the given inequality is the shaded half plane I including the points on the line.
This can be represented as follows.
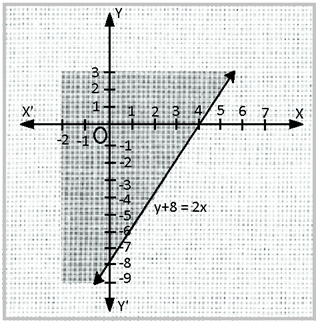
Question 4: Solve the given inequality graphically in two-dimensional plane: y + 8 ≥ 2x
Answer 4: The graphical representation of y + 8 = 2x is given in the figure below.
This line divides the xy-plane in two half planes.
Select a point (not on the line), which lies in one of the half planes, to determine whether the point satisfies the given inequality or not. We select the point as (0, 0).
It is observed that,
0 + 8 ≥ 2(0) or 8 ≥ 0, which is true
Therefore, lower half plane is not the solution region of the given inequality. Also, it is evident that any point on the line satisfies the given inequality.
Thus, the solution region of the given inequality is the half plane containing the point (0, 0) including the line.
The solution region is represented by the shaded region as follows.
Question 5: Solve the given inequality graphically in two-dimensional plane: x – y ≤ 2
Answer 5: The graphical representation of x – y = 2 is given in the figure below.
This line divides the xy-plane in two half planes.
Select a point (not on the line), which lies in one of the half planes, to determine whether the point satisfies the given inequality or not. We select the point as (0, 0).
It is observed that,
0 – 0 ≤ 2 or 0 ≤ 2, which is true
Therefore, the lower half plane is not the solution region of the given inequality. Also, it
is clear that any point on the line satisfies the given inequality.
Thus, the solution region of the given inequality is the half plane containing the point (0, 0) including the line.
The solution region is represented by the shaded region as follows.
Question 6: Solve the given inequality graphically in two-dimensional plane: 2x – 3y > 6
Answer 6: The graphical representation of 2x – 3y = 6 is given as dotted line in the figure below. This line divides the xy-plane in two half planes.
Select a point (not on the line), which lies in one of the half planes, to determine whether the point satisfies the given inequality or not. We select the point as (0, 0).
It is observed that,
2(0) – 3(0) > 6 or 0 > 6, which is false
Therefore, the upper half plane is not the solution region of the given inequality. Also, it is clear that any point on the line does not satisfy the given inequality.
Thus, the solution region of the given inequality is the half plane that does not contain the point (0, 0) excluding the line.
The solution region is represented by the shaded region as follows.

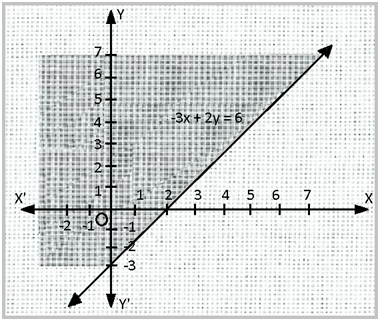
Question 7: Solve the given inequality graphically in two-dimensional plane: –3x + 2y ≥ –6
Answer 7: The graphical representation of – 3x + 2y = – 6 is given in the figure below. This line divides the xy-plane in two half planes.
Select a point (not on the line), which lies in one of the half planes, to determine whether the point satisfies the given inequality or not. We select the point as (0, 0).
It is observed that,
– 3(0) + 2(0) ≥ – 6 or 0 ≥ –6, which is true
Therefore, the lower half plane is not the solution region of the given inequality. Also, it is evident that any point on the line satisfies the given inequality.
Thus, the solution region of the given inequality is the half plane containing the point (0, 0) including the line.
The solution region is represented by the shaded region as follows.
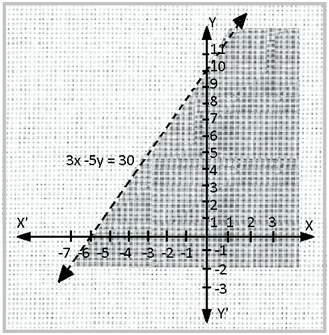
Question 8: Solve the given inequality graphically in two-dimensional plane: 3y – 5x < 30
Answer 8: The graphical representation of 3y – 5x = 30 is given as dotted line in the figure below. This line divides the xy-plane in two half planes.
Select a point (not on the line), which lies in one of the half planes, to determine whether the point satisfies the given inequality or not. We select the point as (0, 0).
It is observed that,
3(0) – 5(0) < 30 or 0 < 30, which is true
Therefore, the upper half plane is not the solution region of the given inequality. Also, it is evident that any point on the line does not satisfy the given inequality.
Thus, the solution region of the given inequality is the half plane containing the point (0, 0) excluding the line.
The solution region is represented by the shaded region as follows.
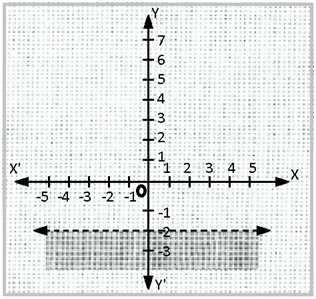
Question 9: Solve the given inequality graphically in two-dimensional plane: y < –2
Answer 9: The graphical representation of y = –2 is given as dotted line in the figure below. This line divides the xy-plane in two half planes.
Select a point (not on the line), which lies in one of the half planes, to determine whether the point satisfies the given inequality or not. We select the point as (0, 0).
It is observed that,
0 < –2, which is false
Also, it is evident that any point on the line does not satisfy the given inequality.
Hence, every point below the line, y = –2 (excluding all the points on the line),
determines the solution of the given inequality.
The solution region is represented by the shaded region as follows.
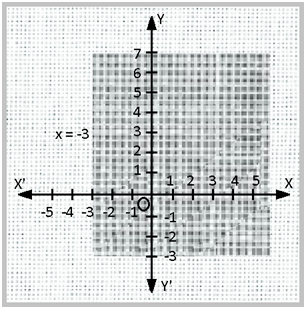
Question 10: Solve the given inequality graphically in two-dimensional plane: x > –3
Answer 10: The graphical representation of x = –3 is given as dotted line in the figure below. This line divides the xy-plane in two half planes.
Select a point (not on the line), which lies in one of the half planes, to determine whether the point satisfies the given inequality or not. We select the point as (0, 0).
It is observed that,
0 > –3, which is true
Also, it is evident that any point on the line does not satisfy the given inequality.
Hence, every point on the right side of the line, x = –3 (excluding all the points on the line), determines the solution of the given inequality.
The solution region is represented by the shaded region as follows.